Having a lot of customers on Airflow and monitoring their data pipelines could become a problem.
There is no way to find which one of 100 pipelines didn’t run today or has been processed more than once.
If you want to know the average times and when all the client pipelines finished you have to dig into the airflow database.
Do you have retries of your tasks? How many?
How your dag executions compared to the one from last week?
For that reason I decided to bring a dashboard with the metrics which I missed.
starting a new project with python poetry is easy and stable. Here are dependencies for postgresql and snowflake
I will use the open source dashboarding tool from https://streamlit.io/
poetry init
poetry add streamlit snowflake-connector-python sqlalchemy
pyproject.toml:
[tool.poetry]
name = "dashboard"
version = "0.1.0"
description = ""
authors = ["gudata <i.bardarov@gmail.com>"]
readme = "README.md"

[tool.poetry.dependencies]
python = "^3.11"
streamlit = "^1.33.0"
psycopg2 = "^2.9.9"
snowflake-connector-python = "^3.9.0"
sqlalchemy = "^2.0.29"


[build-system]
requires = ["poetry-core"]
build-backend = "poetry.core.masonry.api"
Then we define our connections into .streamlit/secrets.toml
[connections.snowflake-admin]
account = "mysnowflakeaccount.us-east-1"
user = "mysnowflakeuser"
password = "thepassword"
database = "theTenantsDatabase"
schema = "theSchema"

[connections.airflow]
dialect = "psycopg2"
url = "postgresql://root:mypassword@myhost-us-east-1.rds.amazonaws.com/airflow_us_ea
st_1"
And we are almost there… Creating the and dashboard is like:
import streamlit as st

snowflake_connection = st.connection("snowflake-admin", type="snowflake")
postgres_connection = st.connection("airflow", type="sql")
Then querying and displaying a chart/table is very easy:
import pandas as pd
def all_dags():
sql_query = """SELECT dag.dag_id
FROM dag
WHERE is_paused = false
AND is_active = true
GROUP BY dag.dag_id
"""
df = postgres_connection.query(sql_query)
return df
def runs_per_dag(dag_id):
sql_query = f"""SELECT dag_id,
ROUND(
(EXTRACT(EPOCH FROM (end_date - start_date)) / 60)
, 0) as duration_in_minutes
FROM dag_run
WHERE 1=1
AND state = 'success'
AND external_trigger=false
AND dag_id='{dag_id}'
ORDER BY duration_in_minutes;
"""
df = postgres_connection.query(sql_query)
return df
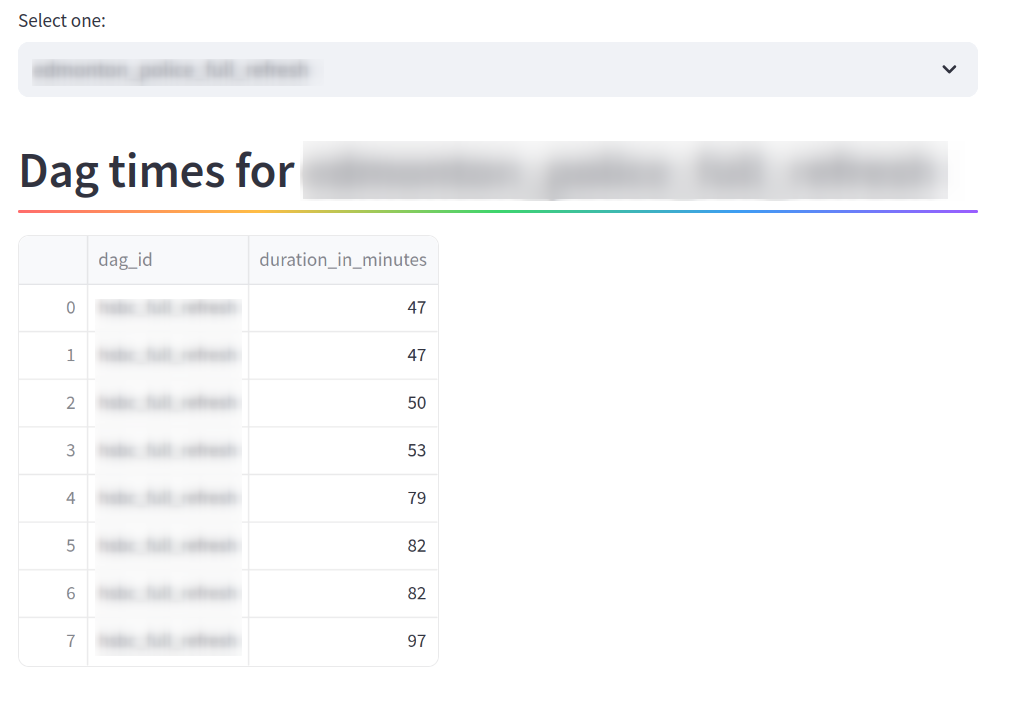
dag_id = st.selectbox("Select one:", all_dags())
st.header(f"Dag times for {dag_id}", divider="rainbow")
st.dataframe(runs_per_dag(dag_id))The result will be
Then you can continue adding elements to dashboard and finally deploy it with Docker where you want to be visible.
For the deploy I used shipit and it is not the shopify one. That one is 4 years old and is small & fast. You can start deploying now, not after 3 days learning curve. I have no idea why such a precious gem is not popular.
You need only one file
.shipit
host='airflow-us-east.example.com'
path='/home/ec2-user/dashboard'

[deploy:local]
echo "Deploying to: $path"
poetry export --without-hashes --format=requirements.txt > requirements.txt
rsync -ahzv --delete ./ $host:$path/
echo "Open http://192.168.1.4:8501/"


[deploy]
  docker build -t airflow_dashboard .
  docker stop airflow_dashboard || true
  docker rm airflow_dashboard || true
  docker run --name airflow_dashboard -d --env-file .env -p 8501:8501 airflow_dashboard

[status]
uptime
The full dashboard code is on GitHub, awaiting you with a lot of useful reports and charts.
- summary of spotted problems
- comparing snowflake(other) table with the dag runs for a specific date
- failed tasks and displays the number of the retries
- Detailed list of the tasks – are they running on the right pool and workers?
- Times for the dags, avg, sum, min, max
- Finish time of all dags, tasks per day
- table view of single dag history